
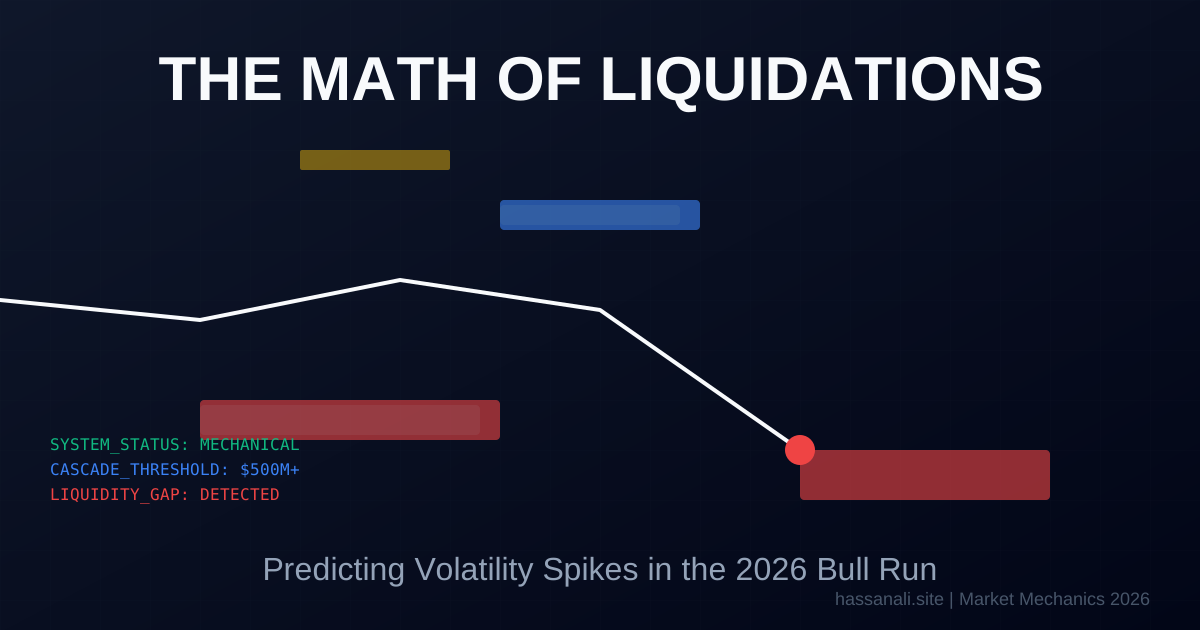
I remember my first time watching a $2 billion “Long Squeeze” in real-time back in 2022. I thought the market was reacting to some catastrophic global news. I checked the wires—nothing. The crash was entirely internal. It was a mechanical failure of the market’s plumbing.
It was a fantastic learning experience.
In 2026, the market has become even more mechanical. With high-frequency bots and institutional ETFs dominating the order book, price action is increasingly driven by Liquidity Hunting. If you don’t understand the math of liquidations, you are trading with a blindfold on.
Here is the real, no-BS guide to predicting volatility spikes using liquidation math.
What You’ll Learn
In this deep-dive into market mechanics, we are exploring the “Guts” of the 2026 bull run. You’ll discover:
- The Fundamental Equations: Isolated vs. Cross Margin Math
- The “Magnet Effect”: Why price gravitates toward liquidation clusters
- Anatomy of a Cascade: Visualizing the slippage loop
- Institutional Absorption: How ETFs have changed the “V-Wick” recovery
- Prediction Models: Using Cumulative Liquidation Delta (CLD) for alpha
Prerequisites
- Basic Algebra: To understand the margin formulas.
- Access to a Liquidation Map: (e.g., CoinGlass, Hyblock, or custom API feeds).
- Understanding of Leverage: (10x, 50x, and the now-standard 125x “Degen” tiers).
Step 1: The Core Equations
Liquidations aren’t random. They are deterministic price points where a trader’s equity hits zero. In 2026, the math is divided into two main risk profiles.
Isolated Margin (Long)
The liquidation price () is where your margin equals the Maintenance Margin.
Cross Margin
In 2026, institutional desks use Cross Margin to buffer volatility. Here, your buffer includes your entire account balance () and unrealized PnL from other positions ().
Key takeaway: Cross margin is safer for single-asset spikes but creates Systemic Risk. If one asset in your portfolio crashes, it can pull your entire account into a “Portfolio Wipeout.”
Step 2: The Anatomy of a Cascade
A liquidation cascade is a chain reaction. It is the reason why “nothing happens for an hour, then everything happens in 60 seconds.”
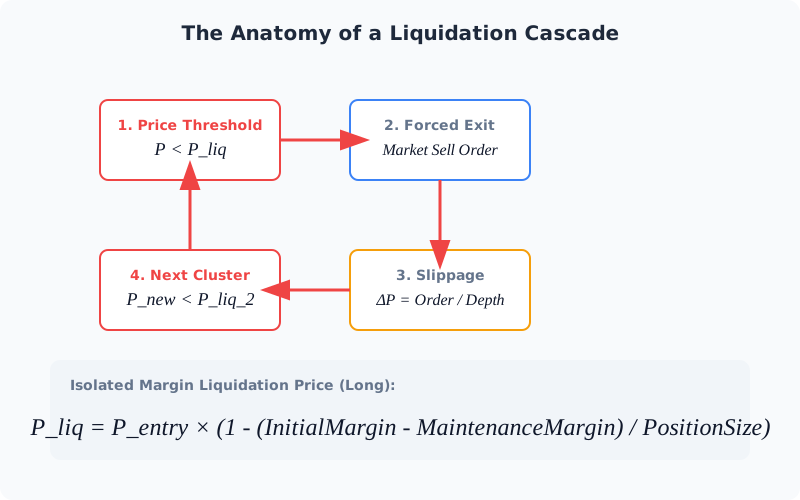
- Threshold Breach: Price hits the first dense cluster of liquidation orders.
- Forced Market Sell: The exchange instantly places market orders to close the positions.
- Slippage Loop: In a thin order book, these market orders push the price down further ().
- The Next Dominos: This new, lower price hits the next cluster of liquidations, repeating the loop.
Step 3: Predicting the Spike — The Heatmap Strategy
In 2026, professional traders use Liquidation Heatmaps as their primary weather map.
Pro tip: Look for “Liquidity Gaps.” These are price zones between two massive liquidation clusters. Once price enters a gap, there is very little resistance, and the price will “teleport” to the next cluster. This is where the fastest 5% moves happen.
Step 4: 2026 Trend — Institutional Absorption
The 2026 Bull Run is unique because of Institutional Buyers. Unlike the 2021 retail-only market, today’s major desks (BlackRock, Fidelity) have algorithms specifically designed to buy liquidation cascades.
This results in the “V-Wick” pattern. Price crashes 10% in 5 minutes (mechanical liquidation) and recovers 8% in the next 5 minutes (institutional absorption).
Strategy: Don’t sell the crash; set “Stink Bids” just below the largest liquidation clusters to catch the institutional bounce.
Step 5: Information Gain — Cumulative Liquidation Delta (CLD)
If you want to know if the market is “top-heavy,” look at the CLD.
- High Positive Delta: There are far more long liquidations waiting below the price than shorts above it.
- The Prediction: The market is “Long Heavy.” A minor macro shock will trigger a disproportionate crash.
Tools and Resources
| Tool | Purpose | Link |
|---|---|---|
| CoinGlass | Real-time liquidation heatmaps | CoinGlass.com |
| VBT2 | Python library for backtesting liquidations | VectorBT.dev |
| TradingView | Custom PineScript for CLD alerts | TradingView.com |
Testing Your Implementation
- Overlay Heatmaps: Add a liquidation heatmap to your BTC/USD chart.
- Spot the Hunt: Observe how often price “wicks” into a high-leverage cluster before reversing.
- Verify the Math: Use the Isolated Margin formula to manually calculate your own “Death Zone” before opening a trade.
Common mistakes:
- Mistake 1: Assuming “News” causes the wick. 90% of sub-15-minute spikes are mechanical liquidations.
- Mistake 2: Ignoring Funding Rates. If funding is extremely high, the “Cost of Carry” for longs makes them more likely to be liquidated first.
Next Steps
- Automated Hedges: Build a Python script that opens a hedge position when price enters a high-density liquidation zone.
- Cluster Analysis: Learn to distinguish between “Retail Clusters” (100x leverage) and “Institutional Clusters” (low leverage).
- Macro Correlation: Track how SOFR rate shifts impact the liquidation thresholds of major trading desks.
TL;DR
- Volatility is Mechanical: Most spikes are caused by forced exits, not news.
- Price is a Magnet: Price hunts dense liquidation clusters for exit liquidity.
- Math over Mood: Use the formulas to manage your own risk scientifically.
- Watch the CLD: A top-heavy market is a fragile market.
If you found this analysis useful, subscribe to my newsletter below for more market mechanics and data science insights.
Have a skill recommendation or spotted an error? Reach out on LinkedIn or email me at [email protected].
Last updated: April 29, 2026